
Analytics
Analytics counts the people who visit your website: how many, how they found it, what they looked at, and what they did. It is Roadside's own count, kept inside Roadside.
In this chapter
What Analytics counts
A small piece of code on your website, called the tracker, reports each page someone opens. Roadside adds it to your pages for you, so nothing needs pasting. Roadside then joins those reports into visits and sorts them into the tabs along the top: Overview, Acquisition, Engagement, Pages, Conversions, Performance and Setup. Staff and Read only roles do not see Analytics. The Store owner and the Manager can both change Setup.
- Page view
- One page shown on someone's screen. Going to another page is another page view, and so is flipping to page 2 of a shop list.
- Visit
- One person's time on your website, from the first page they open until they stop for 30 minutes. If one person opens six pages in a row, that is one visit with six page views. If they come back after half an hour, it is a second visit.
- Visitor
- One browser on one day. Someone who visits on three different days counts as three visitors, because Roadside does not follow people from day to day.
The live view and the days
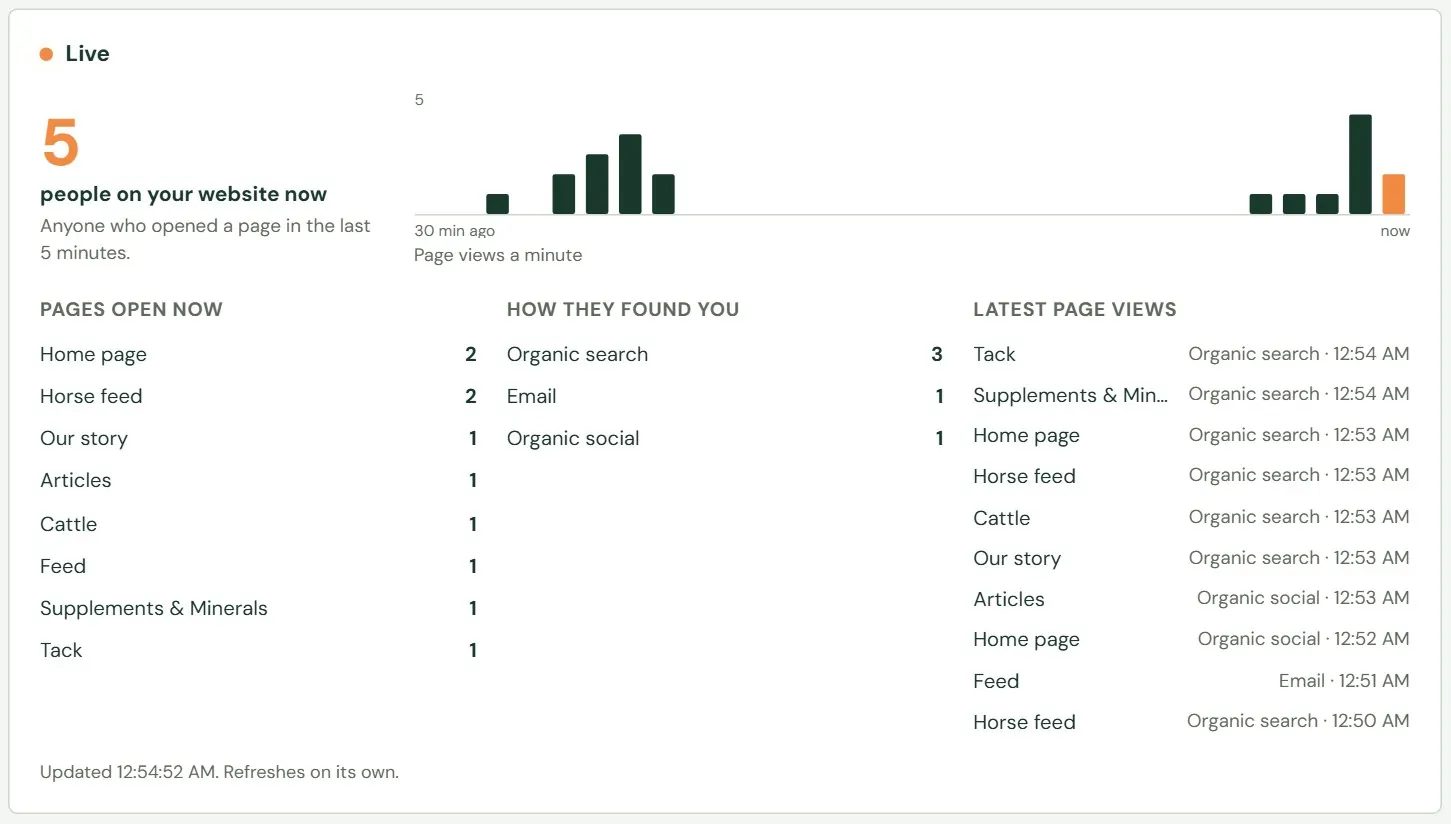
The Overview opens with Live, a count of the people on your website now. It refreshes by itself every 15 seconds while the tab is on your screen.
 123456
- 1Anyone who opened a page in the last 5 minutes.
- 2Page views a minute, for the last 30 minutes. The last bar is this minute.
- 3The pages those people have open.
- 4How they found you, by channel.
- 5The last ten page views, with the channel and the time.
- 6When it last updated.
Under the tabs, press Today, Last 7 days, Last 30 days or Last 90 days to choose the days. The screen opens on the last 7. Every tab but Setup follows your choice. The grey line beside the buttons names the dates and the days they are compared with. Days follow your store's time zone, so "Today" ends at your midnight.
The numbers on the Overview
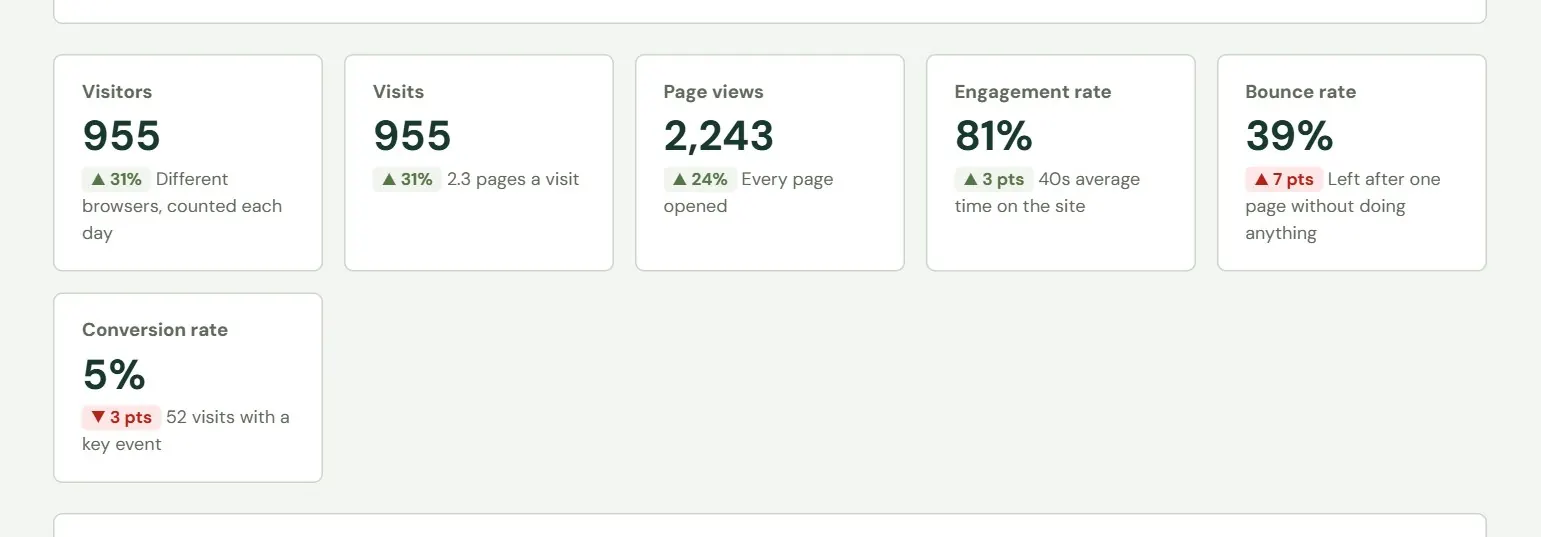
Six tiles sum up the days you chose. Each shows how the number changed against the same number of days just before. A green arrow means it moved in the good direction and a red one means it did not. You may also see Same as before, or New when there was nothing earlier to compare with. Rates show their change in pts, short for percentage points. If the engagement rate goes from 78% to 81%, it is up 3 pts.
- Engaged visit
- A visit that lasted 10 seconds or more with a page showing on the screen, or looked at two pages or more, or included a key event. The engagement rate is the share of visits that were engaged.
- Bounce
- A visit that looked at one page and did nothing on it: no call, form, download or link out. The bounce rate is the share of visits that bounced. A lower bounce rate is better.
- Key event
- An action you decided matters, such as someone tapping your phone number or sending the contact form. You choose them in Setup.
- Conversion
- A visit that included at least one key event. The conversion rate is the share of visits that did.
 123456
- 1Different browsers, counted each day.
- 2How many visits, and how many pages each had on average.
- 3Every page opened.
- 4The share of visits that were engaged, and the average time people stayed.
- 5The share of visits that left after one page without doing anything.
- 6The share of visits that included a key event.
Engagement and bounce are counted separately, so they do not add up to 100. Someone who reads one page for three minutes and leaves is engaged, because the page stayed on the screen for more than 10 seconds, and also a bounce, because they did nothing on it.
Below the tiles, the Overview has Visits a day, a bar for each day when you chose more than one. Then Most viewed pages, with views and the average time each page was on screen. Then How visitors found you, with a bar and a share for each channel. Key events, New and returning and Mobile vs. desktop sit at the bottom, each with a link to the tab that has more.
How people found you
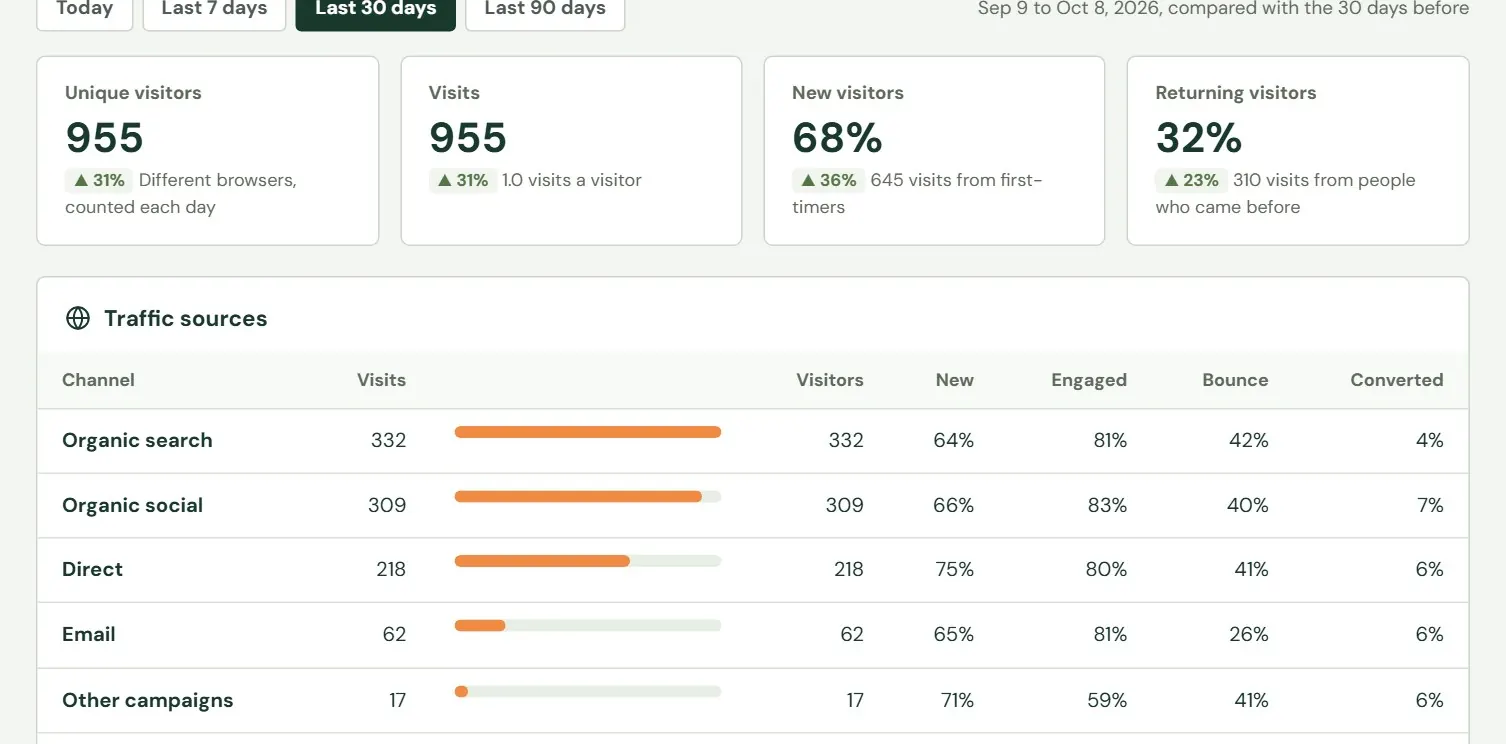
The Acquisition tab answers where visits came from. The top tiles give unique visitors, visits, new visitors and returning visitors. A returning visitor is a browser that visited before, which Roadside learns from the visit cookie described under Setup. A browser that blocks cookies shows as Not known.
 1234
1234- 1Unique visitors, visits, new and returning.
- 2One row for each channel.
- 3The channel, with its visits and a bar.
- 4The share of that channel's visits with a key event.
- Channel
- The kind of place a visit came from. Roadside sorts every visit into one channel, from the first page it opened. Referral is one of them: a visit that came from another website that links to yours.
- Campaign
- One particular push you made, such as a spring sale or the Chick Days email. A link tagged with a campaign name shows up under that name.
Further down the tab is a card headed Organic click-through rate that says Not connected yet. It has nothing to show, so skip it. Under the table, Sites that sent visitors names the websites that sent the most visits, and Campaigns lists your tagged links with their visits. To track a link, add campaign tags to the end of its address before you post it. For example, a Facebook post could link to https://www.bakerfeedandcountrystore.com/?utm_source=facebook&utm_medium=social&utm_campaign=spring-sale. The three tags are the source (where you put the link), the medium (the kind of place) and the campaign (the push). Each tagged link shows in the Campaigns table. Ask for help at support@dirtroadsoftware.com if you want these made for you.
Engagement and the Pages tab
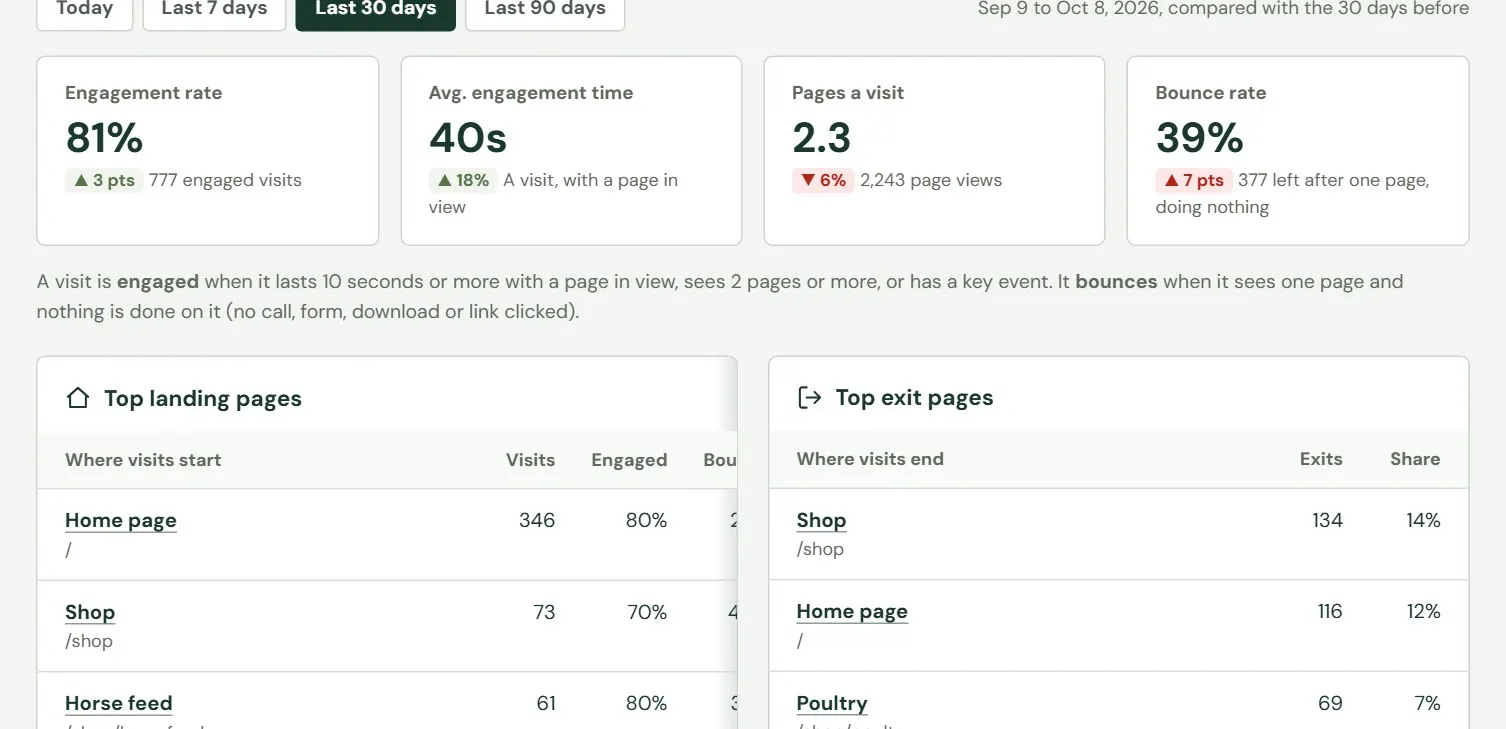
The Engagement tab shows how visits went. Its tiles are the engagement rate, the average engagement time, pages a visit and the bounce rate. Time counts only while a page is showing, its window is in front, and the person has moved, scrolled or typed in the last minute, so a tab left open all night adds nothing.
 1234
1234- 1The rates for the days you chose.
- 2The plain definitions of engaged and bounced.
- 3Where visits start: the landing pages.
- 4Where visits end: the exit pages.
The tab lists your top landing pages (the first page of a visit), your top exit pages (the last), the pages people spend longest on, and engagement by channel. Page names link to that page's own view. Every list names a page by its title, without your store's name on the end. The home page is Home page, and a page with no title is named by its address.
The Pages tab lists every page of your website that was visited. Type part of a name in Find a page and press Find. The Sort by buttons put the most viewed, longest read, furthest read, most often landed on, or most often left from first.
| Column | What it shows |
|---|---|
| Views, Visits | How many times the page was opened, and in how many visits. |
| Avg. time | How long the page was showing on average. |
| Read | How far down the page visitors got, on average, as a percent. |
| Entrances | Visits that started on this page. |
| Bounce | Of those entrances, the share that left after this page with nothing done. |
| Exits, Exit rate | Visits that ended here, and that number as a share of the page's views. |
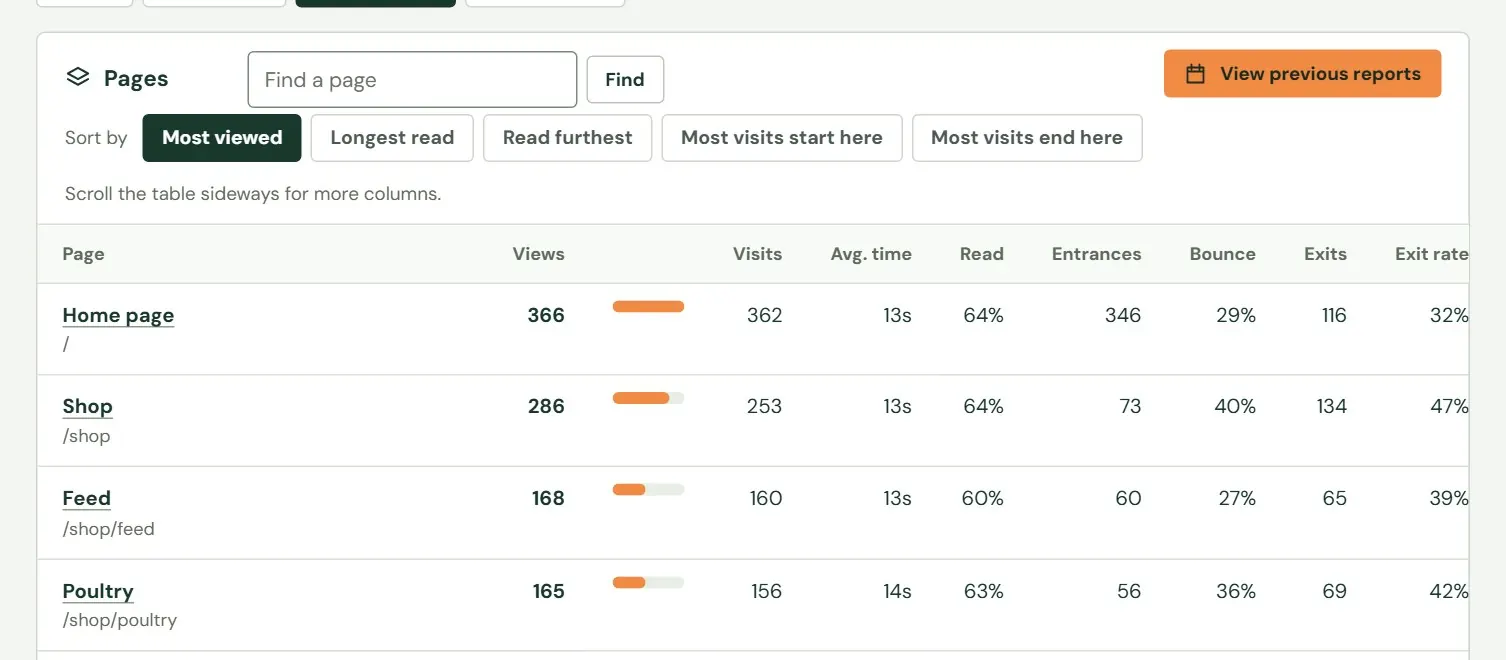 12345
12345- 1Search by the page's name or address.
- 2Download an earlier quarter's page report.
- 3Change the order of the list.
- 4One row for each page.
- 5How far down the page people got, on average.
Press a page's name to see that page on its own: its views each day, which pages people saw just before and just after it, the channels and devices behind its visits, what people did on it, and how fast it loads.
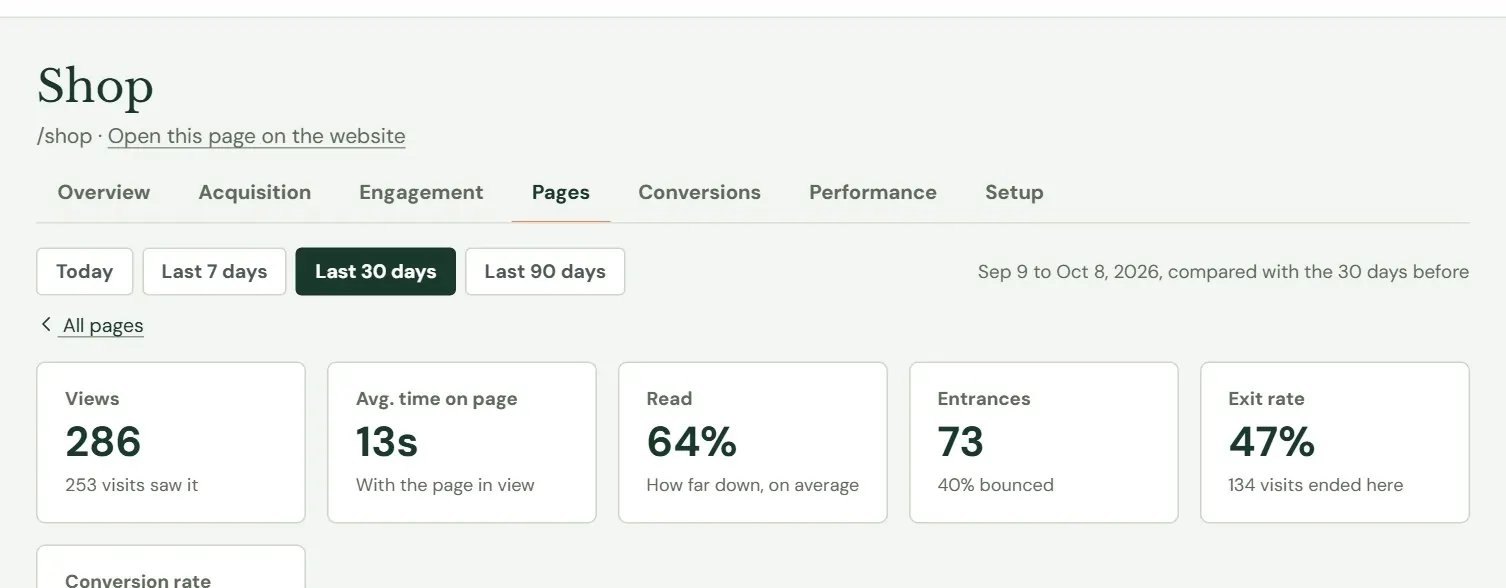 1234
1234- 1The page's name.
- 2Opens the page on your website.
- 3Views, time on the page, how far it was read, entrances, exits and conversions.
- 4Back to the Pages list.
Page reports to download
Press View previous reports to download a finished quarter's page report. Roadside keeps a page report for each finished quarter for three years, even though it keeps the individual visits for about 13 months. A quarter with a report shows Download. Others say No data, or Not finished for this year's quarters still running.
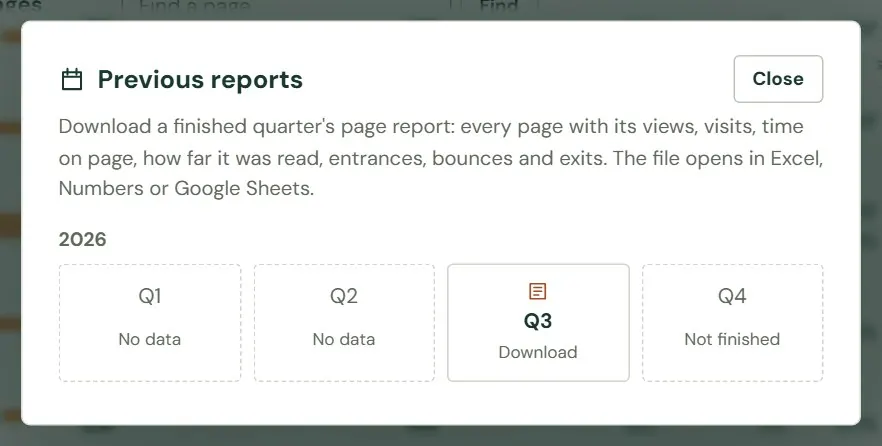 123
123- 1A finished quarter with a report. Press it to download.
- 2A quarter before your website was counted.
- 3A quarter that has not ended yet.
The file is named for the quarter, such as website-pages-2026-Q3.csv. It opens in Excel, Numbers or Google Sheets and holds one row for each page, most viewed first: the page, its title, views, visits, average time in seconds, how far it was read, entrances, bounces, bounce rate, exits and exit rate.
Calls, forms and orders
The Conversions tab counts the actions you marked as key events. Its tiles show the conversion rate, how many visits converted, the key event completions, cart abandonment, and online orders when your store takes them.
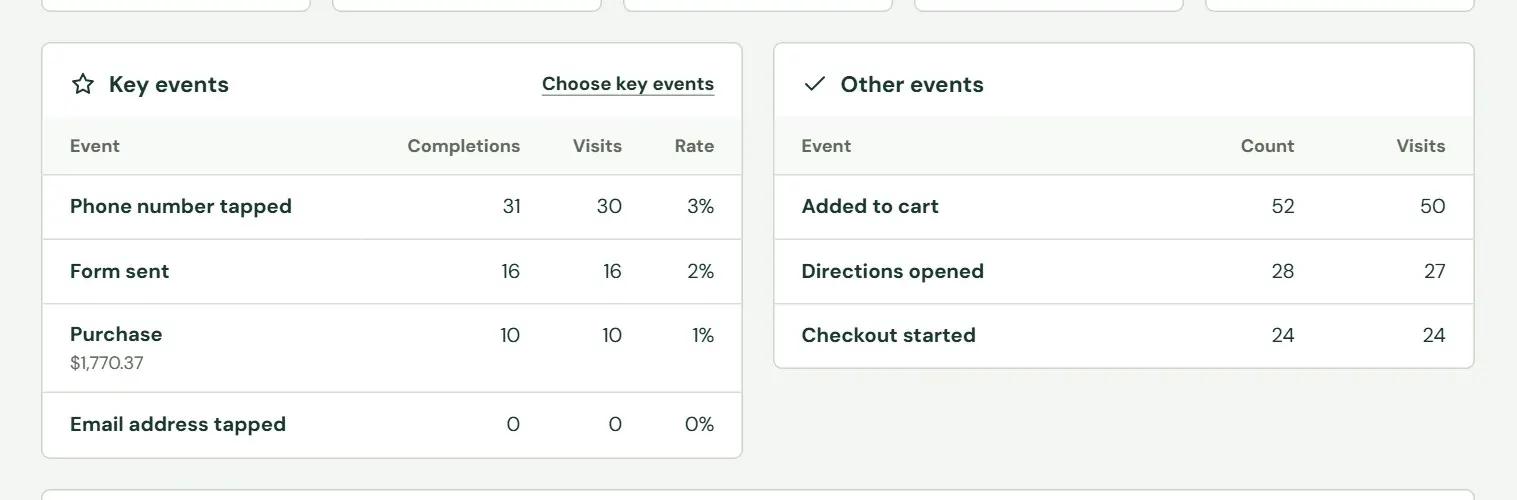 123
123- 1The events you chose as key events, with how many times each happened, in how many visits, and the share of visits.
- 2Goes to Setup, where you choose them.
- 3Everything else the tracker saw: videos played, files downloaded, links to other sites, searches, pages read to the end.
Under them, What people clicked, called and downloaded lists the actual phone numbers tapped, files downloaded, sites linked to and words searched for, with the page they were on. Conversion rate is also broken out by channel and by landing page. The cart card follows visits through three steps, Added to cart, Started checkout and Bought, and says how many reached each one.
- Cart abandonment
- Of the visits that added something to the cart, the share that did not buy in that visit.
Orders placed at your online checkout are counted as a Purchase automatically, once for each order.
How fast your pages load
The Performance tab shows what your visitors' browsers measured: how long your pages took to show and how quickly they reacted. Google judges a page's speed by three measures, called Core Web Vitals, and Roadside rates each one.
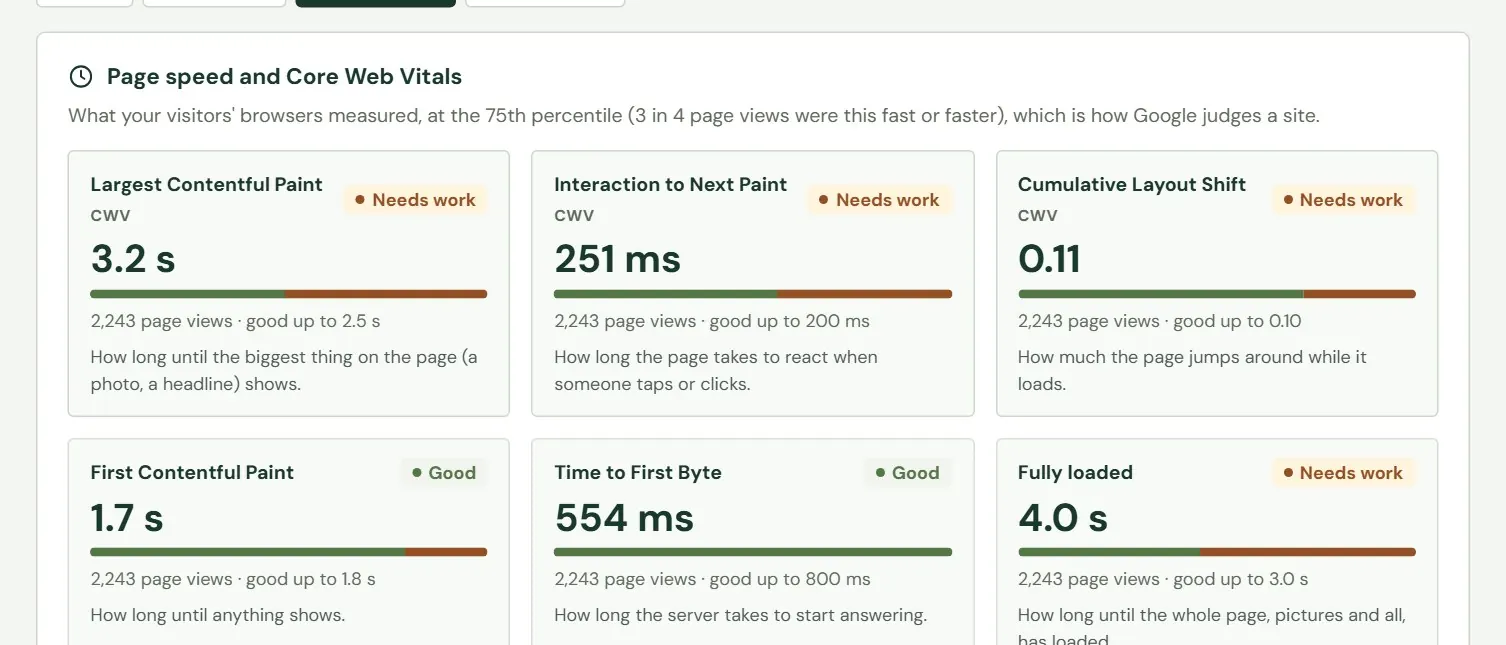 1234
1234- 1How long until the biggest thing on the page, a photo or a headline, shows.
- 2How long the page takes to react when someone taps or clicks.
- 3How much the page jumps around while it loads.
- 4Good, Needs work or Poor.
- Core Web Vitals
- Google's three page-speed checks: how fast the main content shows (LCP), how fast the page reacts to a tap (INP), and how much it moves while loading (CLS).
- 75th percentile
- The speed that 3 visits out of 4 matched or beat. Roadside rates on it so that a few slow visits do not spoil a page's rating.
A rating is Good, Needs work or Poor against Google's cutoffs, which each tile shows: for example, the biggest item on the page should show in 2.5 seconds or less, and a time over 4 seconds is Poor. Three more measures are on the tab: First Contentful Paint (until anything shows), Time to First Byte (how long your website takes to start answering) and Fully loaded. A page is as good as its worst Core Web Vital. Safari and Firefox do not report every measure, so some come from Chrome and Edge visitors only. The tab also breaks visits down by device type, screen size, browser and operating system.
Setup
Setup has no day buttons. Everyone who can see Analytics can read it. Only the Store owner and the Manager can change it.
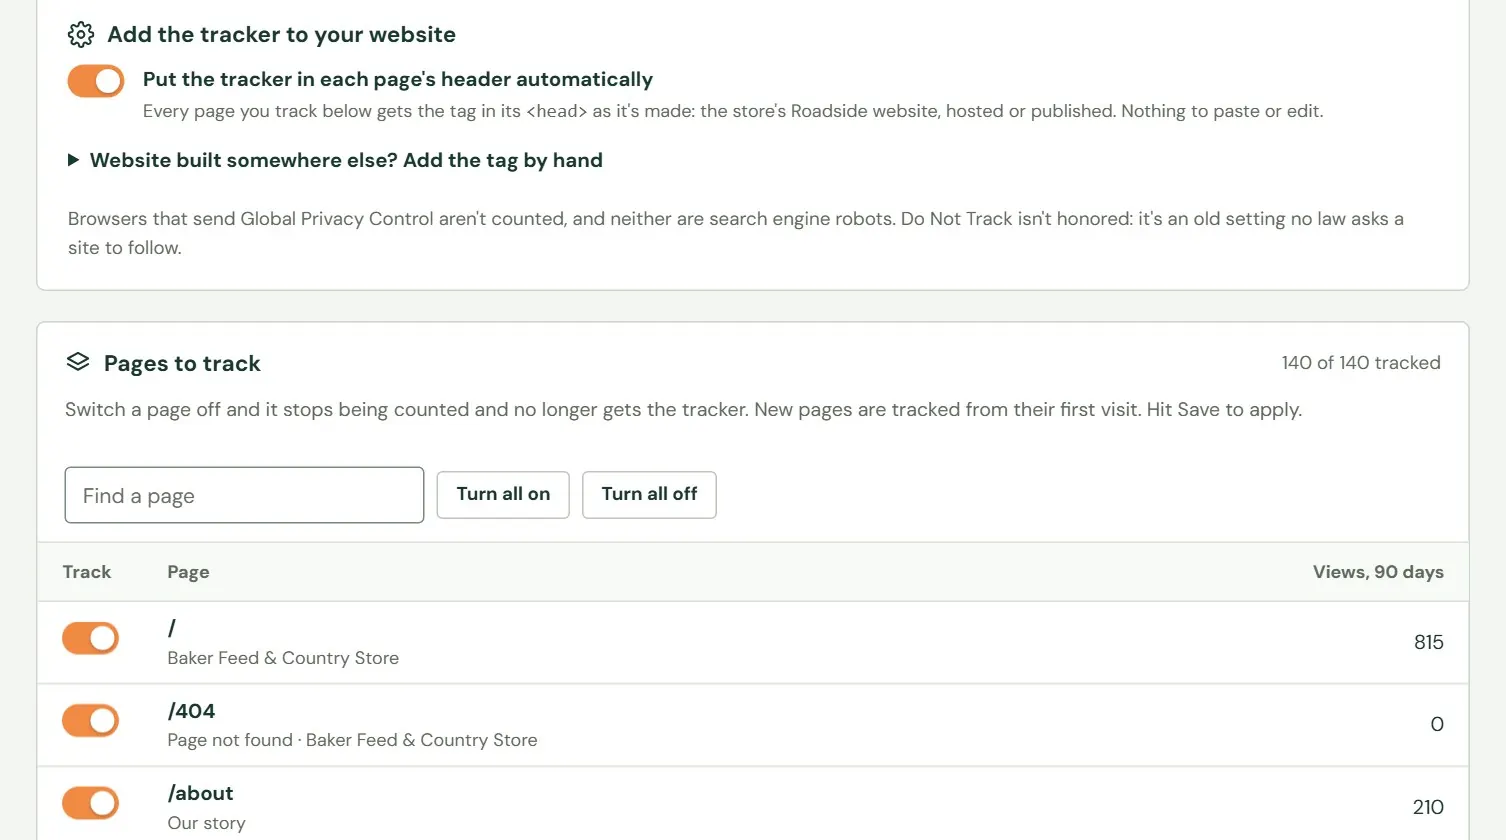 12345
12345- 1Puts the tracker on each tracked page for you.
- 2For a website built somewhere else. Leave it closed unless Dirt Road asks you to open it.
- 3How many pages are tracked.
- 4Look for a page by its name or address.
- 5Turn one page off, or on again.
Leave Put the tracker in each page's header automatically on. With it off, and no tag put on the website by hand, nothing is counted.
Choose which pages are tracked
Every page of your website is tracked until you switch it off. A page you switch off stops being counted, which suits a thank-you page after an order. Use Find a page to find it, switch it off, and press Save. If a page is not on the list, type its address, such as /thank-you, in the box under the list. Turn all on and Turn all off act on the pages the box is showing. New pages are tracked from their first visit. Page switches go by address, so a renamed page counts as a new page. A page you turn off stops being counted now, and stops loading the tracker after your next website update.
Choose which events count as key events
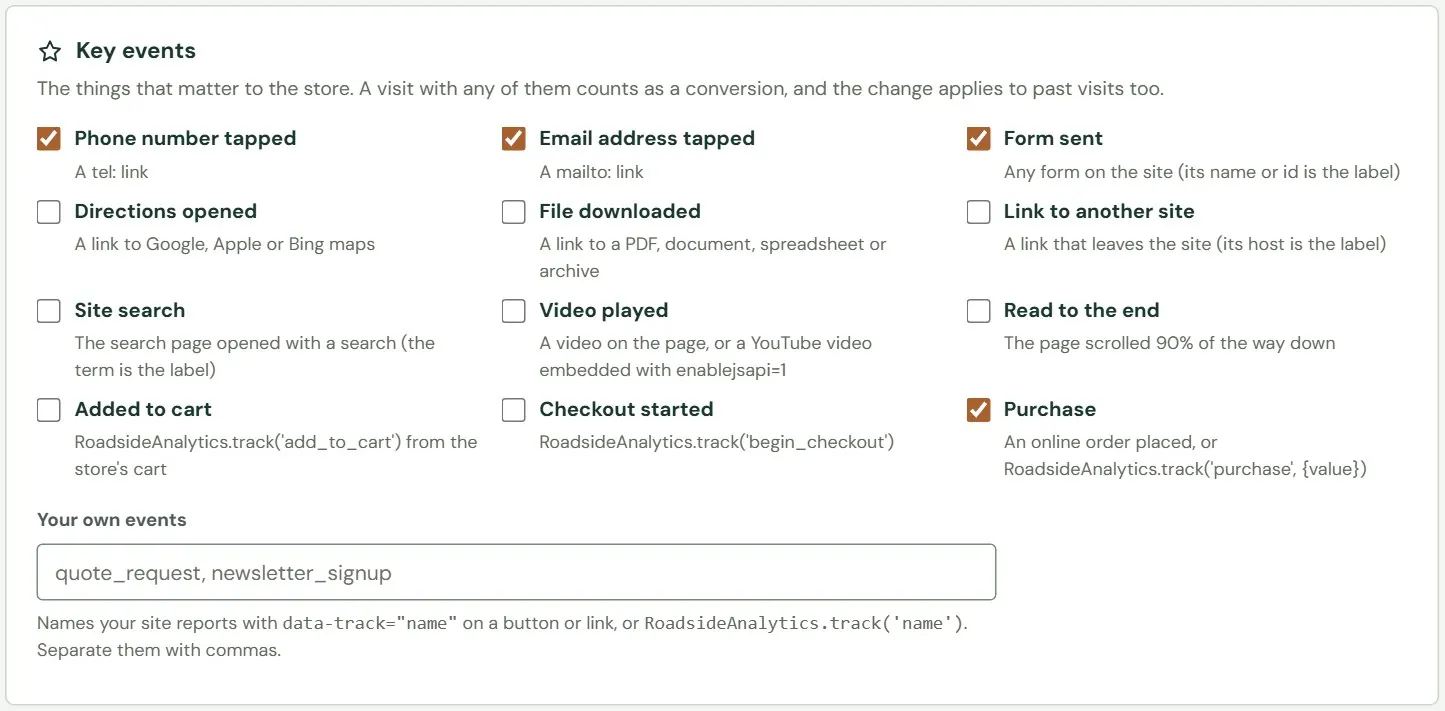 12
12- 1Tick the actions that matter to your store.
- 2Your own events, if your website reports any.
A visit with any ticked event counts as a conversion. Roadside starts with four ticked: Form sent, Phone number tapped, Email address tapped and Purchase. Directions opened is worth ticking for a store people drive to. Your choice applies to every report, including days that have passed, so changing it changes the earlier numbers too.
The visit cookie
With Tell visitors apart with two small cookies on, a visitor's browser keeps two small files. One holds only the date of their last visit, so Roadside can tell a new visitor from a returning one. The other is a random code for the day, which the browser deletes when the day ends. Neither holds a name or anything else that points to a person. Roadside shows visitors no cookie banner. With the switch off, or in a browser that blocks cookies, a visitor counts as neither new nor returning.
What Analytics counts, and what it leaves out
For each page, the tracker reports the page's address (never anything after a question mark), its title, where the visitor came from and any campaign tags on the link. It also reports the screen width, how long the page was showing, how far down it was read, how fast it loaded, and what the visitor did. Roadside keeps the device type and the browser's name. It does not keep the visitor's IP address, the browser's full description, or anything a visitor typed into a form. A site search keeps the words searched for.
- Not counted: browsers that send Global Privacy Control, a setting some privacy-minded visitors switch on, and known robots such as search-engine crawlers and link checkers. The older Do Not Track setting is ignored: those visits are counted.
- Counted: your own visits to the live website. There is no setting to leave yours out.
- Not counted: payment pages. They never carry the tracker.
- Kept for: visits for about 13 months, then deleted. Each finished quarter's page report is saved first and kept three years.
Reading the numbers without over-reading them
A store with a few dozen visits a day will see a number swing for no reason you can find. A page that had 4 views last week and 6 this week shows an arrow up 50%, and the whole change is two people. Look at Last 30 days or Last 90 days before you decide that anything changed, and compare Saturdays with Saturdays: most stores are busiest on one weekend day, and a holiday week shifts things too.
Visitors are browsers on a day, so one person on two phones counts twice, and one person on the shop's Wi-Fi who comes back next Tuesday is a new visitor. A small difference between two channels, or between two pages, is not a result. A big change that holds for weeks is worth acting on, such as a drop in calls after you changed the contact page, or a jump in visits after a Chick Days post.
If the store also has Google Analytics, treat it as a separate count. The two will not match, because each defines visits and visitors in its own way and because Roadside leaves out browsers that send Global Privacy Control and known robots. Pick one for each question and stay with it.
Something here does not match your screen? Write to support@dirtroadsoftware.com with the name of the screen, what you pressed and what you expected. A picture of the screen helps.